
Number of Hats on Truck Dashboard Correlated with Masculinity, Study Finds
After months of data collection and statistical analysis, the Texas A&M University Department of Statistics has released their latest study concerning a possible relationship between a given individual’s masculinity and the number of hats displayed on the dashboard of their trucks. Testing at a 95% significance level and using a multivariable ANOVA and Tukey HSD post-hoc test, the study has concluded that there is significant evidence supporting a positive correlation between the two variables with an r2 value of 0.999 and a p-value of < 0.00001.
Sample populations were collected from Lot 100 and its satellite parking lots via a stratified random sampling method. The strata were separated by number of hats on a given dashboard and assigned, in accordance with other variables, to a masculinity scale ranging from “almost a woman” to “a real man’s man.” A table of the variables accounted for in the study and the resulting linear regression are included below.
| VARIABLE | CRITERIA BREAKDOWN |
| Number of 4H Championships | Weighted based on number and size of state championship belt buckles |
| Number of Snapchat Streaks | Weighted based on gender of recipient and length of streak; extra consideration given to those who save snap messages |
| Association with Men’s Organizations | Weighted based on membership, organization type, and length of membership |
| Number of Ex-Girlfriends/Interests | Weighted based on relationship duration, break-up circumstances, and any relationships with her friends following separation |
| Truck Brand | Weighted based on country of manufacture and average carbon emission |
Fig. 1. Table listing possible compounding variables taken into consideration during this study and breakdowns of variable weighting.
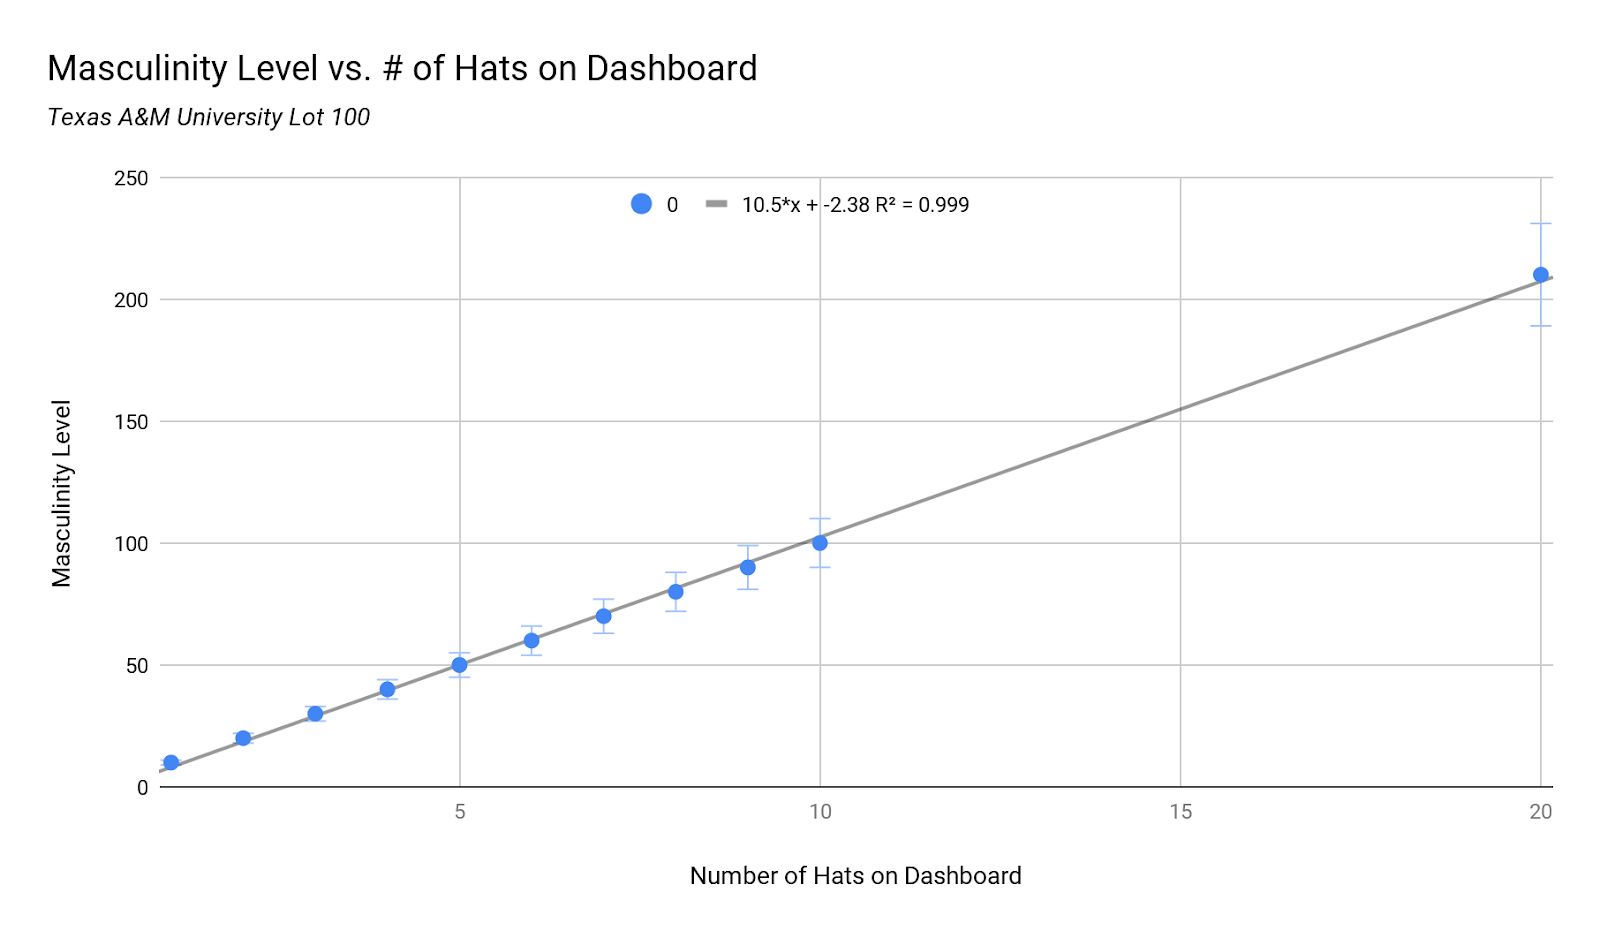
Fig. 2. Comparison of masculinity level vs. number of hats on dashboard, including trendline and r2 value.
Of the many variables accounted for in this study, possible confounding variables include hats on the dashboards of vehicles other than trucks, men who do not own camouflage crocs, men who abstain from dip, and men without at least one pair of knee-high rubber wading boots in the back of their truck. However, it can be reported with 95% confidence that a strong relationship between the two variables studied will be observed again if sampling is repeated.
It is important to note that one individual observed in this study would be defined by the statistics community as “an absolute madman.” This individual, who cannot be publicly identified for privacy reasons, had 20 hats on his truck dashboard that were all neon in color and all from different large animal feed stores. It was reported that the Department of Statistics plans to conduct an additional investigation into how this man became an absolute unit.
—Flash it Back, Ags
You may have seen her skulking around campus in a beige trenchcoat, waiting for the perfect moment to reveal her ass to unsuspecting students. An exhibitionist at heart, she’s been arrested for streaking fifteen times since 2012. UPD is aware of her presence and is doing their best to keep her away from sporting events, graduations, and the background of promotional materials. You can often find her doing squats at the Rec. If you ask politely, she might just show you her assets.